lengths <- rnorm(n=1000, mean = 10, sd=1)Acquiring data
Sampling and related issues
How do we get data?
Let’s start our statistics journey by thinking about the simplest scenario: We want to know something about a group. An example might be the average (also known as the mean, we will define later if needed!), the minimum value, or the maximum value for some trait. These questions all deal with the distribution of values for that trait in the group. These specific traits of the group distribution are called statistics:
the numerical facts or data themselves - Dictionary.com
This means we have a target trait we are focused on, and we have defined a group of interest. We can call this group of interest a population. Note that while the term population may have specific meanings in some fields (such as ecology), here population is just the group of interest. It could be a population of Goliath grouper in Florida, a population of flowers in Virginia, or people from a certain country or demographic group. We could want to know something about all of these groups!
As we’ve already noted, in a perfect world we know everything (or at least everything about our trait value) for every member of the focal population. However, we often don’t and can’t measure every member of a population. It may be too difficult or expensive to measure every member of the population. In fact, we may not even know how large the population is!
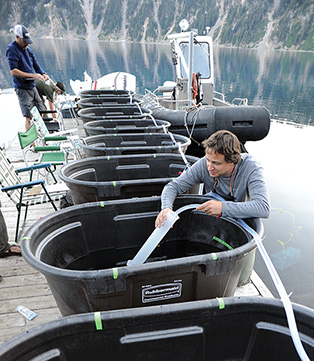
In the cases where we can’t measure every member of the population, we collect data on the focal trait(s) from a sample. A sample is the subset of the population of interest. Data can be collected from samples used in experimental studies, where researchers manipulate something to see how it impacts the focal trait. Researchers may expose organisms to different stimuli in controlled lab, field, or mesocosm studies to see what happens. For example, researchers interested in impacts of an invasive crayfish (Pacifastacus leniusculus) on Mazama newts (Taricha granulosa mazamae) collected newts and crayfish.; they then placed either just newts or newts and crayfish in in large tanks to observe interactions (Girdner et al. 2018).
Data can also be collected from observational studies, where researchers “simply” measure outcomes and other traits without manipulating anything. For example, scientists interested in impacts of climate change on species ranges surveyed sites for species presence and abundance and compared it to historical data (Sagarin et al. 1999). Note doing this may actually be very difficult! Metcalfe, Yaicurima, and Papworth (2022) found that just observing capuchin monkeys (Sapajus macrocephalus) changed their behavior.
_1.jpg)
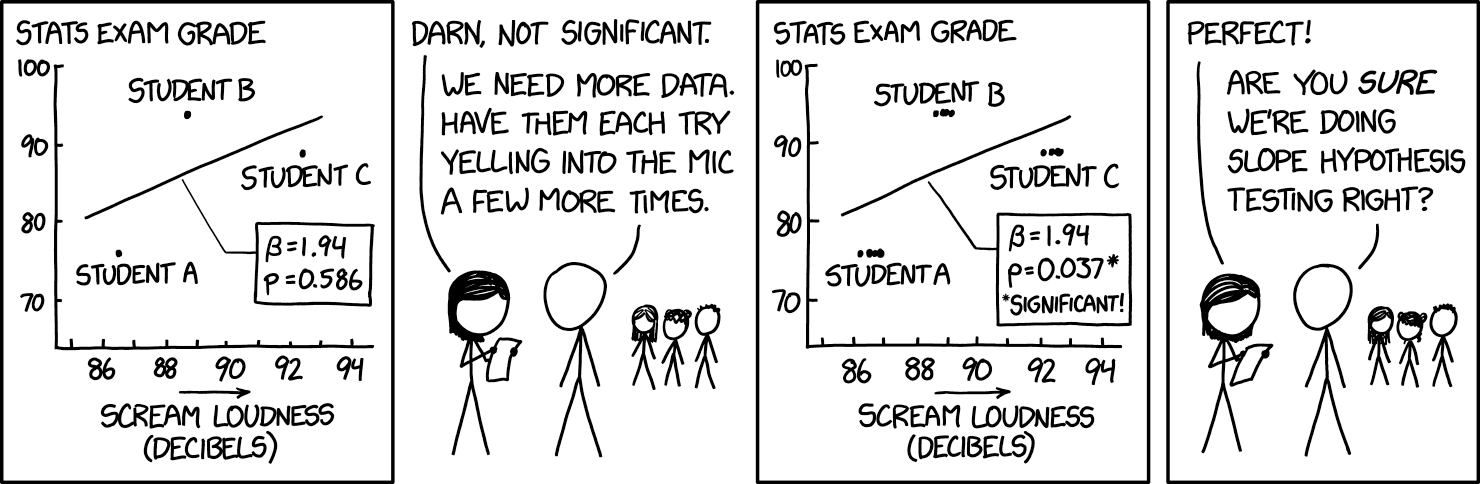
Different types of studies change what we can use the data for. We’ll come back to this later, but, in general, experimental studies are more commonly used to ascertain causation (something makes something happen), whereas observational studies are used to assess correlation (something happens when something else happens, also known as association). However, these can be hard to disentangle, especially since studies can only be observational since experiments would be unethical or impossible to carry out. As XKCD puts it

Correlation doesn’t imply causation, but it does waggle its eyebrows suggestively and gesture furtively while mouthing ‘look over there’ - XKCD #552
Once we have the sample, we can measure the trait of interest in it, and use that to estimate the statistic of interest for the actual population. This is the science of statistics, which can actually be defined as
the practice or science of collecting and analyzing numerical data in large quantities, especially for the purpose of inferring proportions in a whole from those in a representative sample. - Oxford English Dictionary
If the whole idea of statistics is to infer something about the population from our sample, we need to make sure the sample is representative of the population. That means it should not be biased. Bias occurs if the trait values we measure in our sample differ from the population in a consistent way. This can happen with samples of convenience, or when researchers select samples that are easy to measure but may not be representative of the population. Classic examples include estimating the amount of time students spend studying by surveying students at a campus library.
Bias may also be related to issues of independence. In a good sampling design, every member of the population has the same chance of being included in a sample. Samples of convenience violate this premise, and often the underlying issue is that the samples are not independent. A perfect solution is to randomly choose members of the population to be in the sample, but that is often not possible. Again, it requires knowing every member of the population! Independence also means each data point is not related to any others!
In some cases linkages among samples are impossible to avoid. We will cover ways to address that using blocking factors or random effects later.
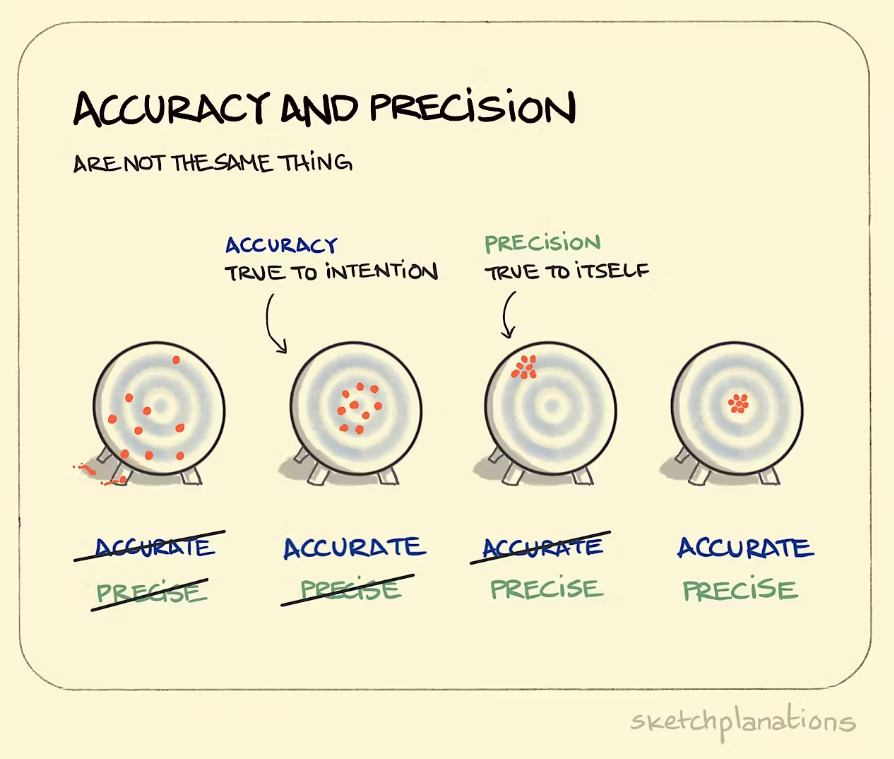
Notice in discussing bias this way we are not directly focusing on the quality of the measurements. Obviously we need good data to make good estimates, but these ideas are different from our current focus on picking a good sample. If we want to discuss the quality of our measurements, we could think about accuracy (how well we measure the underlying trait in regards to its true value, which we typically don’t know) and precision (how repeatable our measurement technique is).
Even if we have a proper way to measure a trait (accurate and precise) in a good sample (not biased), we will still be producing an estimate of the population statistic! This is due to sampling error. Sampling error refers to the fact that every sample will produce a slightly different estimate of the statistic. Imagine this - there a 1000 fish in a lake. We sample 50 of them, measure their length, and use it calculate the average fish length. If we took a different sample, do you think it would have exactly the same average?
We can demonstrate this in R - you won’t understand the code below yet, so just trust me for now, but this will let you start seeing code and thinking about how to use it.
Let’s generate a population of fish. We’ll store their lengths in a vector called lengths.
The average length of fish in this population is 10.02 cm (Note: if you view this on the webpage you will see a number, but in the actual qmd file you see R code here - this is an example of merging code and text!). We can then simulate a sample from this population. In fact, let’s simulate 2 and compare the means of each.
sample_1 <- sample(lengths,50)
sample_2 <-sample(lengths, 50)
The mean length for fish in sample 1 is 10.03 cm, while that in sample 2 is 10 cm . These are both close to the true value, but they are also both slightly different - this is sampling error!
Sampling error always exists, and a major part of statistics is to quantify it. One thing that reduces sampling error is to have large samples! Remember, if we measure every member of the population we don’t even need statistics, so the closer we get to that (implying larger samples) the better!
Next steps
Now that we have data, we’ll discuss summarizing it in the next section (and actually define mean and some of the other terms we’ve started to use!).
References
Girdner, Scott F., Andrew M. Ray, Mark W. Buktenica, David K. Hering, Jeremy A. Mack, and John W. Umek. 2018. “Replacement of a Unique Population of Newts (Taricha Granulosa Mazamae) by Introduced Signal Crayfish (Pacifastacus Leniusculus) in Crater Lake, Oregon.” Biological Invasions 20 (3): 721–40. https://doi.org/10.1007/s10530-017-1570-6.
Metcalfe, Chloë Alexia, Alfredo Yhuaraqui Yaicurima, and Sarah Papworth. 2022. “Observer Effects in a Remote Population of Large-Headed Capuchins, Sapajus Macrocephalus.” International Journal of Primatology 43 (2): 216–34. https://doi.org/10.1007/s10764-021-00264-w.
Sagarin, Raphael D., James P. Barry, Sarah E. Gilman, and Charles H. Baxter. 1999. “Climate-Related Change in an Intertidal Community over Short and Long Time Scales.” Ecological Monographs 69 (4): 465–90. https://doi.org/10.2307/2657226.