Why do we need statistics?
Welcome
Why do people get cancer?
Do “toxins” really harm the environment?
Is organic food really healthier?
This site is meant to accompany biostatistics courses I teach at Baruch College and the CUNY Graduate Center. Biostatistics is a growing field that uses real data to objectively answer questions like the ones shown above. Statistics is the science of using data collected from one or more samples or experiments to characterize populations or determine relationships among variables. Since statisticians rely on and communicate data, the field also offers insight on data collection and presentation. Biostatisticians are statisticians who are focused on questions related to the natural world, including environmental and human health. In this introductory course we will learn basic introductory statistics but with a focus on biological applications and examples. Practical goals for this course are for students to learn - why various tests exist - how they relate to each other - when one should be used as opposed to another - how to defend the choices you made or evaluate those of others!
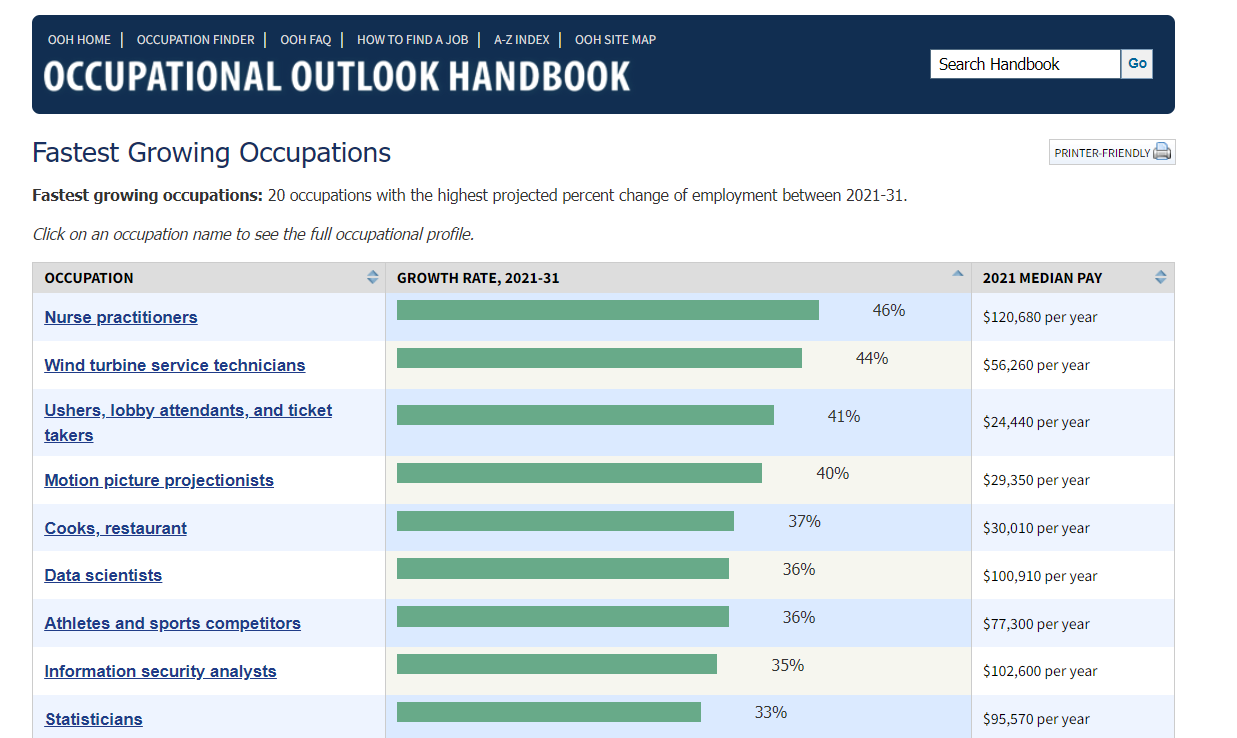
Statistics is also one of the fastest growing job areas in the country and offers a transferable skill set for students. With this in mind, the course will be taught so that students can learn skills they could use in settings ranging from research labs to future jobs. This will include an introduction to the R programming language and version control.
This site is part of the course resources that now include
- course notes/book
- tutorials for many lessons using Swirl
- this site!
All of these resources may prove useful in learning the material. I hope you find the materials useful and learn to see statistics as more than something you do to finish a project or a course that you are required to take. The materials are mainly written in quarto, a derivative/extension of rmarkdown, which allows R code and prose to be easily created and published together. You can see the code for all the material on github, and you will learn early on how to make a copy of the material that you can work on yourself. The first few labs are standalone units to introduce students to tools; later lectures have code integrated directly into the lecture slides.