Biostatistics
Concepts and approaches for collecting good data and turning it into knowledge
Welcome
This book is meant to accompany biostatistics courses I teach at Baruch College and the CUNY Graduate Center, but it may offer another perspective to anyone trying to learn statistics, R, or some combination. The class now includes
- a website housing slides and associated material
- this was the original “home” for the material, and it is being updated to point here
- tutorials for many lessons using Swirl
- this book!
All of these resources may prove useful in learning the material.
I say another perspective because an immediate question should be why the world needs another self-published statistics book, especially one focused on introducing R. There are already many, many good ones (some of which are shared at the end of each of relevant chapter and in the list of additonal resources).To this I offer a few responses
- As already noted, this book was designed to accompany courses I teach. Having the material presented in the same order, but with additional context, should help students learn the material.
- The courses I teach focus on introducing statistics from a biological perspective, so examples, papers, and problems focus on natural systems when possible. Having examples, including from published papers, that introduce the need and use of various tests should aid in helping students learn
- why various tests exist
- how they relate to each other
- when one should be used as opposed to another
- how to defend the choices you made or evaluate those of others!
Here there be monsters, but also opportunities!
Statistics is a complex field that is unfortunately often stuffed into the curriculum of other majors (see above). However, my goal is to teach the concepts while also giving students the tools to actually address questions. Given these goals,
we’ll learn how to use tools and applications including R (through Rstudio), git, and markdown. If this is your first time using any (or all) of these tools, don’t worry. We will start at the very beginning.
There are many, many ways to do any task in R. I will show you one (sometimes two) for a given concept, but note you may find other approaches online or in other material
I typically use verbose coding (more words and lines, but easier to read and understand). I know much of what we do could be done in fewer steps, but speed is commonly less of an issue than readability (which is connected to responsibility) for our fields
Given our focus on concepts, we will not dwell on the proofs or other mathematical components of statistics. I’m happy to point you towards texts to help with those, or discuss them.
We will use easy examples to illustrate concepts and applications (toy datasets), which make it easier for you to update in the future (real data are often messy!) while also connecting our class to real-life papers and ideas as much as possible

Be warned: You may encounter some questions as we introduce new material. For example, we’ll talk about normality before fully explaining it. We’ll also use code (to make figures, for example) before you understand it. Feel free to ask questions, but you can also be sure we’ll cycle back (and expand) on many topics. I’ll also add asides/tangents throughout the book to help answer some common questions that pop up.
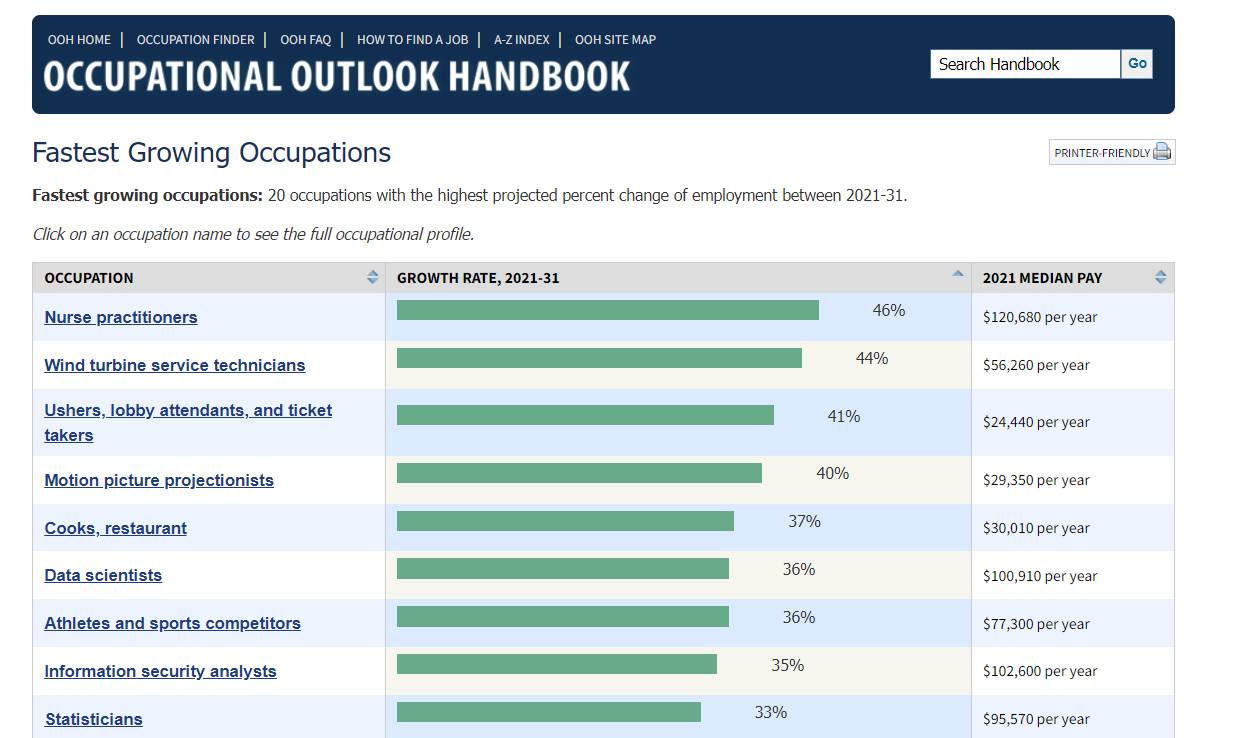
Hopefully this will open the door to careers in data science (a related term) and statistics to some students who haven’t considered that path before. Jobs in these fields are some of the fastest growing in the country, and the skills you learn in this class, including
Critical thinking
Coding
R
markdown
git
Data wrangling
Visualization and stats
Writing and communication
will be some of the most transferable you acquire as an undergraduate.
I hope you find the book useful and learn to see statistics as more than something you do to finish a project or a course that you are required to take. The book is written in quarto, a derivative/extension of rmarkdown, which allows R code and prose to be easily created and published together. You can see the code for all the material on github, and you will learn early on how to make a copy of the material that you can work on yourself.